How to Actually Understand Your Spending: BUDGT's New Analytics Dashboard

You’ve been tracking your expenses for weeks. Maybe months. Every coffee, every grocery run, every random Amazon purchase — logged.
And yet, at the end of the month, you still wonder: where did it all go?
Here’s the uncomfortable truth: tracking alone isn’t enough. Logging expenses tells you what you spent. Understanding why you spent it — the patterns, the triggers, the hidden habits — that’s what actually changes behavior.
BUDGT’s new analytics dashboard is built to bridge that gap. Not with complicated graphs or financial jargon, but with four simple insights that answer the questions you’re actually asking.
The Problem With Just Tracking
Most expense tracking apps stop at the log. You see a list of purchases, maybe a pie chart of categories, and that’s it. You’re left to figure out the patterns yourself.
But patterns are exactly what matter:
| What Tracking Shows | What You Actually Need to Know |
|---|---|
| ”You spent $847 this month" | "You’re spending $12/day faster than last month — why?" |
| "Coffee: $68" | "You spend 3x more on coffee on Mondays — rough starts?" |
| "Weekend total: $312" | "Every weekend costs you more than your entire weekday budget” |
The difference is actionable insight. And that’s what the analytics dashboard delivers.
Four Insights That Actually Help
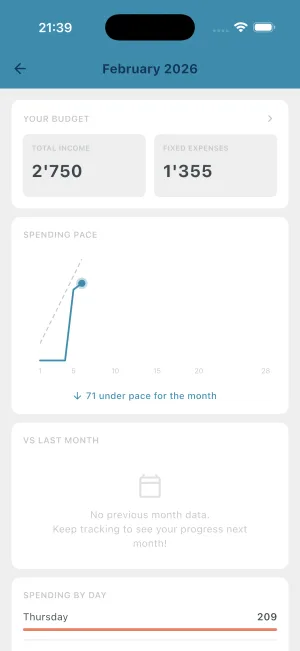
1. Spending Pace: Are You On Track?
The most important question mid-month isn’t “how much have I spent?” It’s “am I going to make it?”
The spending pace chart answers this instantly:
- A line shows your ideal spending trajectory for the month
- Your actual spending is plotted against it
- If you’re above the line, you’re spending too fast
- If you’re below, you’re ahead of schedule
This is the insight that lets you course-correct before it’s too late. Seeing you’re 15% over pace on day 12 means you can tighten up for the remaining 18 days — instead of discovering the problem on day 30.
How to use it: Check your pace weekly. If you’re consistently above the line by mid-month, identify what’s driving it and adjust.
2. vs Last Month: Instant Context
“I spent $1,200 this month.”
Is that good? Bad? You have no idea without context.
The vs-last-month comparison gives you that context automatically:
| This Month | Last Month (Same Point) | What It Means |
|---|---|---|
| $1,200 | $1,100 | Spending $100 more — worth investigating |
| $1,200 | $1,400 | Actually doing better — nice work |
| $1,200 | $1,200 | Right on track with your pattern |
No mental math. No digging through old records. Just a quick answer to “how am I doing compared to normal?”
How to use it: If you’re consistently higher than last month, something changed. New subscription? More dining out? The insight is knowing something shifted — then you can find what.
3. Day-of-Week Analysis: Hidden Patterns
This is where most people discover something surprising about themselves.
Example: Average Spending by Day of Week
The day-of-week chart shows your average spending for each day. And the pattern is often dramatic:
- Weekend surge: Most people spend 40-60% more on Saturdays than weekdays
- Monday effect: Some people overspend Mondays (treating themselves after a rough start)
- Payday bump: If you get paid on a specific weekday, that day often shows a spike
Knowing the pattern is powerful. If you see Saturdays averaging $50 while weekdays average $18, you can:
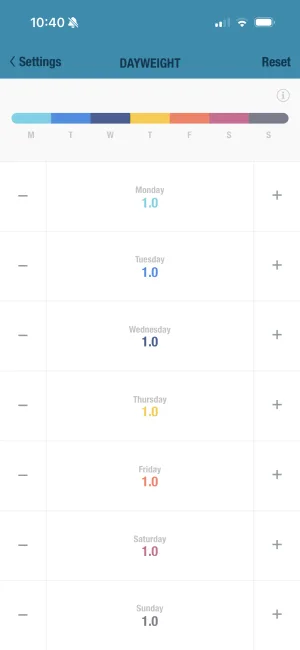
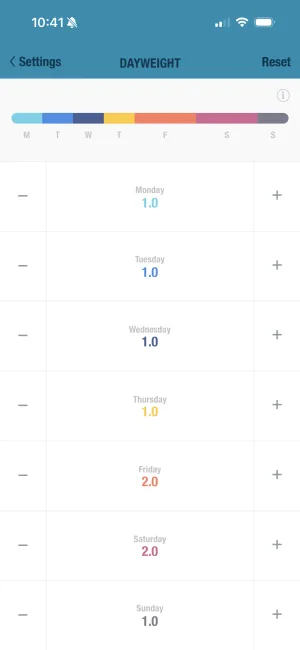
- Plan for it — Budget more for weekends using BUDGT’s day weights feature
- Reduce it — Consciously decide to spend less on weekend activities
- Accept it — Weekend spending might be intentional (social activities, family time)
The point isn’t that weekend spending is bad. The point is knowing it exists so you can make informed choices.
4. Top Expenses: The Big Ones
Sometimes a single purchase throws off your entire month. The top expenses list shows your biggest spending items, ranked.
This is useful for:
- Catching outliers: That $180 “miscellaneous” purchase you forgot about? It’s right there.
- Identifying repeats: If your top expenses are three separate Amazon orders, maybe there’s a pattern.
- Reality checks: Seeing your top 5 purchases in one place can be sobering.
How to use it: Scan your top expenses weekly. Anything surprising? Anything you wouldn’t buy again? Use this as a mini-audit.
Combining Insights With Action
Analytics without action is just interesting data. Here’s how to turn insights into behavior change:
The Weekly Review (5 minutes)
| Step | What to Check | What to Do |
|---|---|---|
| 1 | Spending pace | Above target? Identify which days were heavy |
| 2 | vs last month | Higher than usual? What’s different this month? |
| 3 | Day-of-week | Weekend heavy? Plan next weekend’s activities in advance |
| 4 | Top expenses | Any regrettable purchases? Note them for next time |
Pairing Analytics With Other Features
BUDGT’s analytics works best when combined with the app’s other tools:
| Insight | Pair With | Why |
|---|---|---|
| Weekend spending high | Day weights | Allocate more budget to weekends intentionally |
| One category dominates | Category targets | Set a limit for that specific category |
| Pace consistently over | Savings mode | Reduce daily budget to build in a buffer |
| Certain days always high | Calendar view | Review what happened on those specific days |
What Analytics Won’t Tell You
Let’s be realistic about what any analytics can and can’t do:
Analytics reveals patterns. It shows you that Saturdays cost more, that you’re ahead of pace, that dining out is your biggest category.
Analytics doesn’t explain why. Only you know that Saturday spending is high because of kids’ activities, or that dining out spiked because you hosted your parents.
Analytics doesn’t judge. A $200 weekend isn’t “bad” if it was intentional. A perfectly flat spending line isn’t “good” if you’re depriving yourself.
The goal isn’t to minimize every chart to zero. The goal is awareness — knowing what’s happening so you can decide if it aligns with your values and goals.
Your First Week With Analytics
Here’s a simple plan for getting value from analytics right away:
Day 1: Open the analytics dashboard. Just look. What surprises you?
Day 3: Check your spending pace. Are you on track, ahead, or behind?
Day 7: Review your day-of-week chart. What pattern do you see?
End of Month 1: Compare your month-end balance to previous months. Did awareness change anything?
Most people find that simply seeing the patterns starts to change them. When you know Saturdays cost twice as much as Tuesdays, you naturally pause before that extra weekend purchase.
Privacy Note
One more thing worth mentioning: all of this analytics runs 100% on your device.
BUDGT doesn’t send your spending data anywhere. There’s no cloud processing, no AI analyzing your purchases, no server that could be breached. The analytics dashboard crunches your local data and shows you results — all offline.
This matters because financial data is sensitive. Your spending patterns reveal a lot about your life. With BUDGT, that information stays exactly where it should: on your phone, under your control.
Start Understanding Your Spending
If you’ve been tracking expenses but feeling like you’re missing the bigger picture, the analytics dashboard is built for you.
It won’t make budgeting complicated. It won’t drown you in charts. It gives you four focused insights that answer the questions actually worth asking:
- Am I on track this month?
- How does this compare to last month?
- Which days cost me the most?
- What were my biggest expenses?
That’s it. Simple patterns that lead to better decisions.
Frequently Asked Questions
Why do I need spending analytics if I already track my expenses?
Tracking tells you what you spent. Analytics tells you why patterns exist — like why you consistently overspend on weekends or why certain weeks drain your budget faster than others. Understanding patterns is the first step to changing them.
How does BUDGT's spending pace chart work?
The spending pace chart shows your actual spending compared to where you should be at this point in the month. If the line is above the target, you're spending faster than planned. If it's below, you're on track to have money left over.
What does the vs-last-month comparison show?
This comparison shows whether you're spending more or less than you were at the same point last month. It gives you instant context without mental math — useful for catching trends before they become problems.
Can I see which days I spend the most?
Yes. The day-of-week analysis shows your average spending for each day of the week. Most people discover they spend significantly more on weekends than they realize.
Does the analytics feature require internet access?
No. Like everything in BUDGT, analytics runs 100% offline using only the data on your device. Nothing is sent to external servers.
How far back does the analytics data go?
Analytics uses your complete expense history in BUDGT. If you've been tracking for months or years, you'll see patterns across that entire timeframe.
Related Articles


Ready to take control of your budget?
Download BUDGT and start tracking your daily spending today.